ROAS & ROI CALCULATOR.
FIND YOUR IDEAL BUDGET.
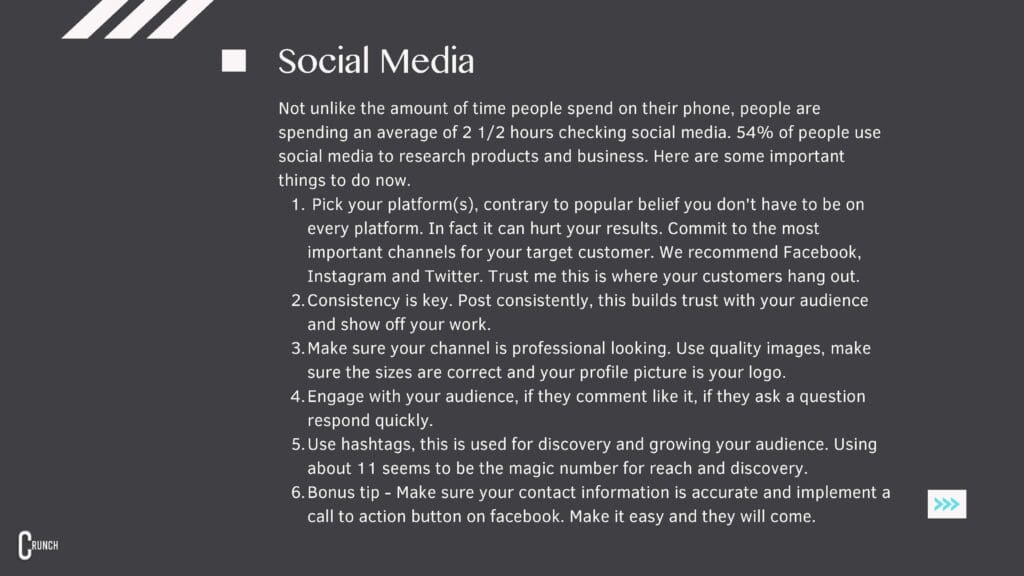
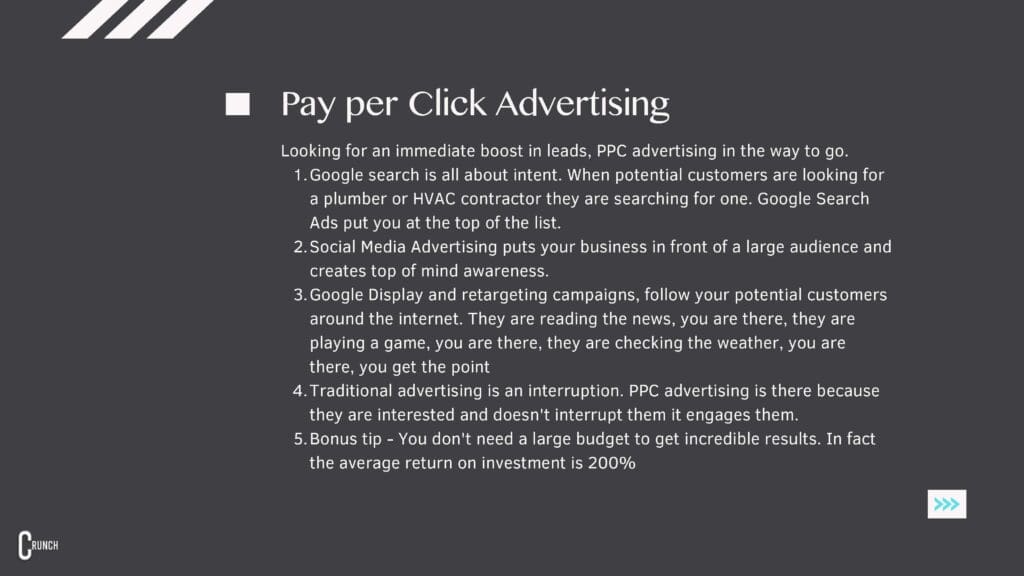
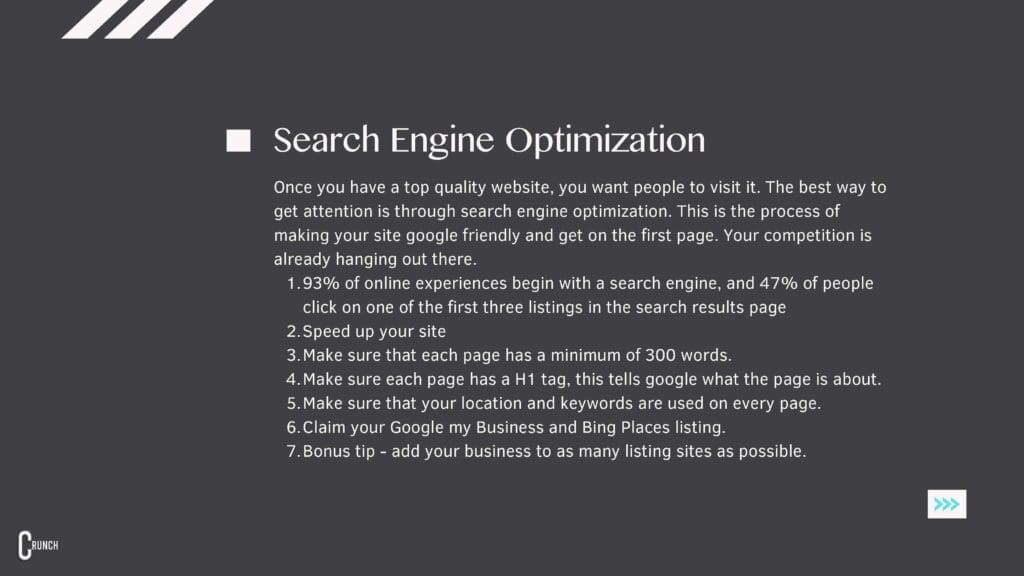
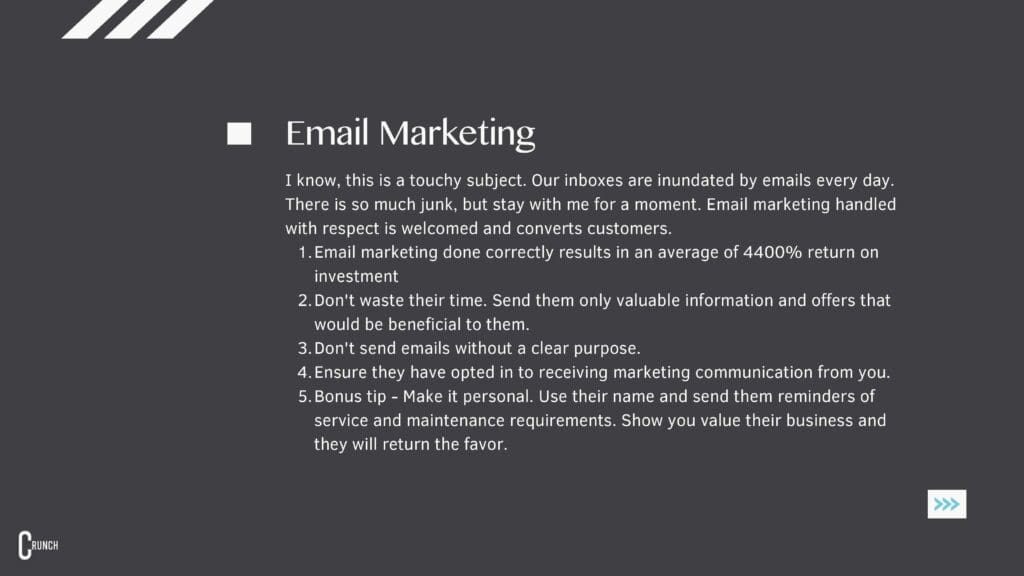
Avoid excess ad spend. Our ROAS & ROI Calculators help you pick your perfect advertising budget.
Average Numbers
by platform and by industry
Average Click Through Rate (CTR)
| Industry | Search | Display | Social |
| Advocacy | 4.41% | 0.59% | 0.62% |
| Auto | 4.00% | 0.60% | 0.8 |
| B2B | 2.41% | 0.46% | 0.78 |
| Consumer Services | 2.41% | 0.51% | 0.62 |
| Dating & Personals | 6.05% | 0.72% | 1.16% |
| E-Commerce | 2.69% | 0.51% | 1.59% |
| Education | 3.78% | 0.53% | 0.73% |
| Employment Services | 2.42% | 0.59% | 0.47% |
| Finance & Insurance | 2.91% | 0.52% | 0.56 |
| Health & Medical | 3.27% | 0.59% | 0.83% |
| Home Goods | 2.44% | 0.49% | 0.70% |
| Industrial Services | 2.61% | 0.50% | 0.71% |
| Legal | 2.93% | 0.59% | 1.61% |
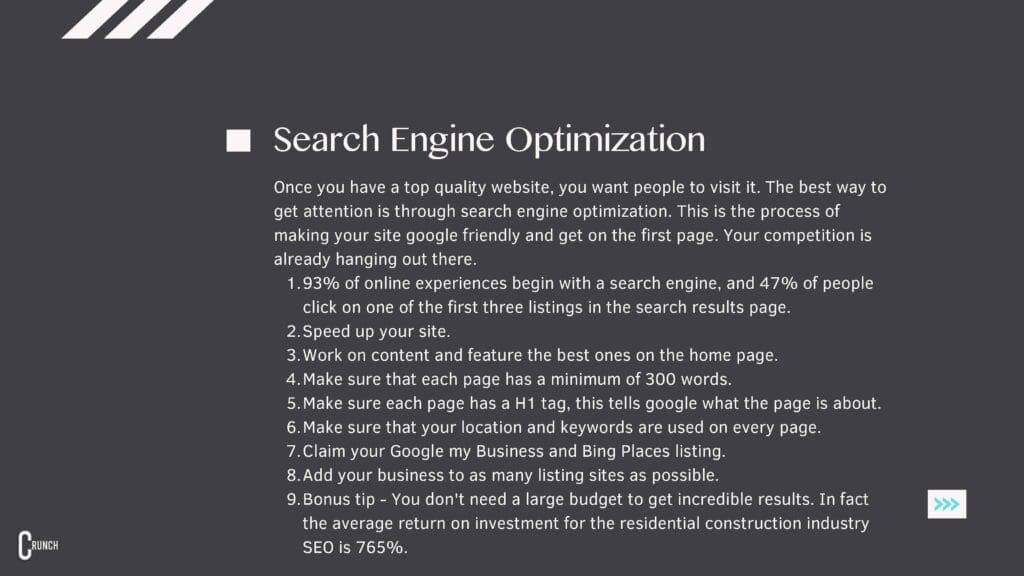
| Real Estate | 3.71% | 1.08% | 0.99% |
| Technology | 2.09% | 0.39% | 1.04% |
| Travel & Hospitality | 4.68% | 0.47% | 0.90% |
Average Cost Per Thousand (CPM)
Digital
| Platform | Average CPC | Average CPM |
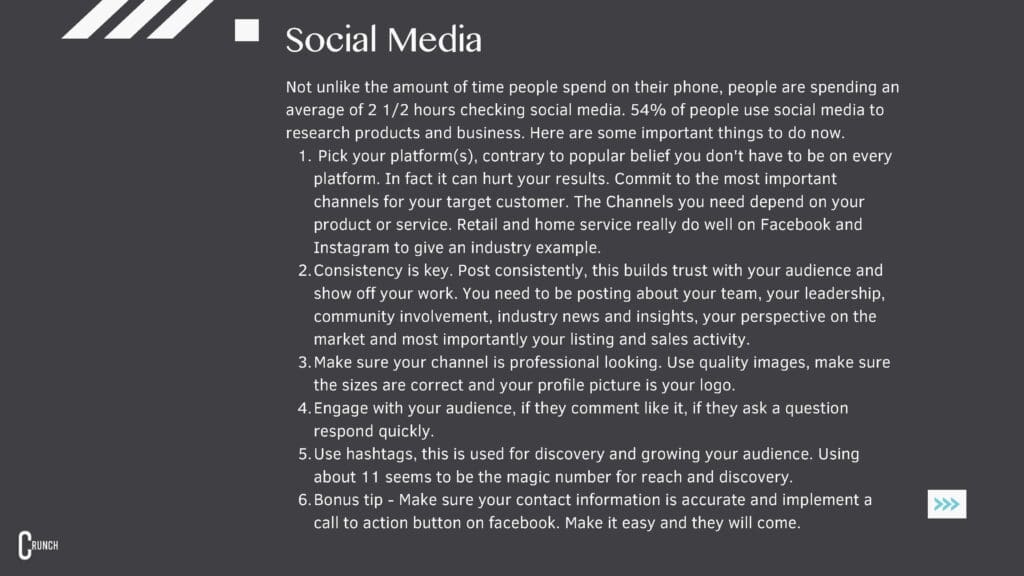
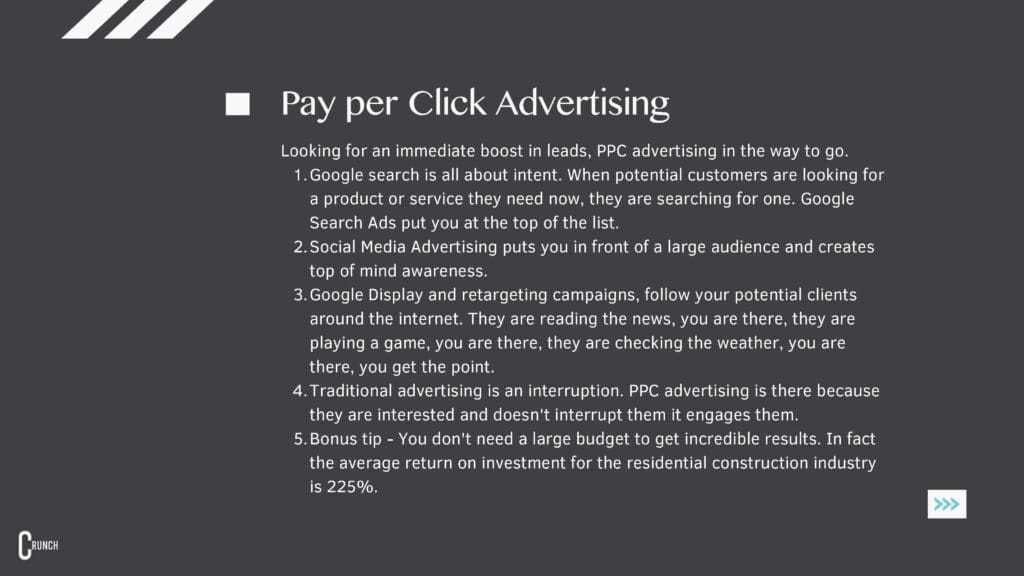
| Google Search Ads | $2.32 | $38.40 |
| Google Display Ads | $0.67 | $3.12 |
| Facebook Ads | $1.35 | $8.60 |
| Instagram Ads | $3.56 | $8.96 |
| Twitter Ads | $0.38 | $6.46 |
| LinkedIn Ads | $5.26 | $6.59 |
| Pinterest Ads | $1.50 | $30 |
Traditional
| Platform | Average CPM |
| Billboard | $13-22 |
| Radio | $10-20 |
| Magazine | $140-$1,300 |
| Newspaper | $10-45 |
| Direct Mail | $500-1,000 |
| Network TV | $20-30 |
| Super Bowl | $36 (4 million dollars, reach 111 million people) |
Average Conversion Rate (CVR)
| Industry | Search | Display | Social |
| Advocacy | 1.96% | 1.00% | 2.32% |
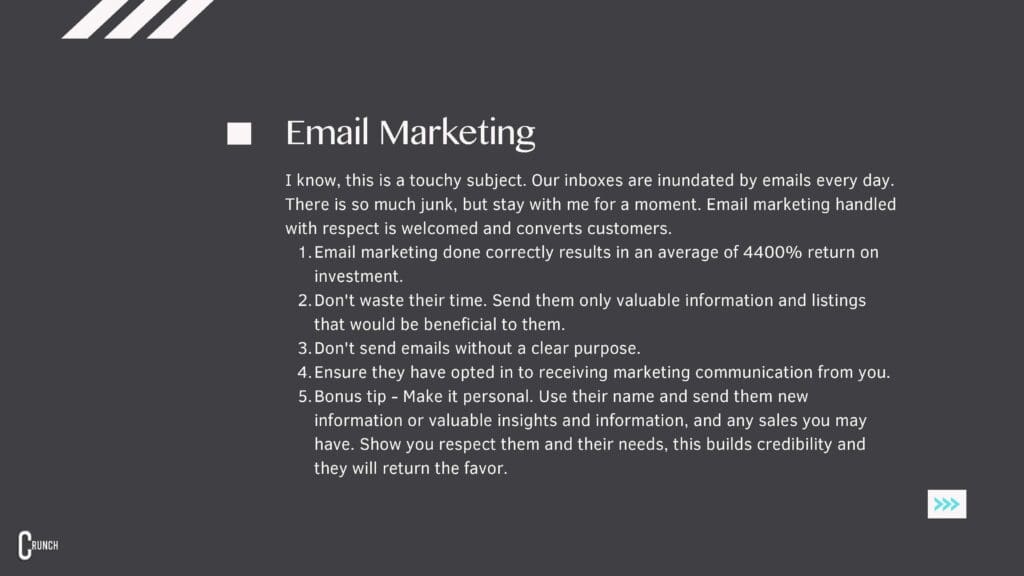
| Auto | 6.03% | 1.19% | 5.11% |
| B2B | 3.04% | 0.80% | 10.63% |
| Consumer Services | 6.64% | 0.98% | 9.96% |
| Dating & Personals | 9.64% | 3.34% | 7.10% |
| E-Commerce | 2.81% | 0.59% | 3.26% |
| Education | 3.39% | 0.50% | 13.58% |
| Employment Services | 5.13% | 1.57% | 11.73% |
| Finance & Insurance | 5.10% | 1.19% | 9.09% |
| Health & Medical | 3.36% | 0.82% | 11.00% |
| Home Goods | 2.70% | 0.43% | 6.56% |
| Industrial Services | 3.37% | 0.94% | 0.71% |
| Legal | 6.98% | 1.84% | 5.60% |
| Real Estate | 2.47% | 0.80% | 10.68% |
| Technology | 2.92% | 0.86% | 2.31% |
| Travel & Hospitality | 3.55% | 0.51% | 2.82% |
Average Cost Per Click (CPC)
| Industry | Search | Display | Social |
| Advocacy | $1.43 | $0.62 | 0.58% |
| Auto | $2.46 | $0.58 | 2.24% |
| B2B | $3.33 | $0.79 | 2.52% |
| Consumer Services | $6.40 | $0.81 | 3.08% |
| Dating & Personals | $2.78 | $1.49 | 1.81% |
| E-Commerce | $1.16 | $0.45 | 0.70% |
| Education | $2.40 | $0.47 | 1.06% |
| Employment Services | $2.04 | $0.78 | 2.72% |
| Finance & Insurance | $3.44 | $0.86 | 3.77% |
| Health & Medical | $2.62 | $0.63 | 1.32% |
| Home Goods | $2.94 | $0.60 | 2.93% |
| Industrial Services | $2.56 | $0.54 | 2.14% |
| Legal | $6.75 | $0.72 | 1.32% |
| Real Estate | $2.37 | $0.75 | 1.81% |
| Technology | $3.80 | $0.51 | 1.27% |
| Travel & Hospitality | $1.53 | $0.44 | 0.63% |

